


Guidance vs. EA: which is the better spell?
- Llew
- Aug 28, 2021
- 5 min read
Updated: Aug 17, 2022
Before one D&D session, my half-orc druid was preparing to research in the library about a monster they've adopted. I knew there were two spells that could increase my chances of rolling well on an Investigation check: Guidance and Enhance Ability (specifically Fox's Cunning). Each has different mechanics, Guidance gives you a +d4 to any ability check and it's a cantrip so you can use it as many times as you like, while Enhance Ability gives you advantage on a single type of ability check for an hour but it's a 2nd level spell so you can only use it as many times as the number of >2nd level spell slots you have. So to figure out which would benefit my half-orc's research the most, like any good statistician I coded some dice simulations.
Simulating Guidance Rolls
Guidance lets you add a d4 to any ability check, therefore to simulate the possible outcomes we have to add all the possible d20 rolls to all the possible d4 rolls.
>#all possible d20 values
>rolls.g = c(1:20)
>#d4 values
>d4.g = c(1:4)
>#possible outcomes, roll + d4
>final.rolls.g.m = outer(rolls.g, d4.g, FUN = '+') # creates a matrix that sums the two dice together
>final.rolls.g = c(final.rolls.g.m) #turns the matrix of outcomes into a vector (for later)
>final.rolls.g = sort(final.rolls.g, decreasing = F) #sorts the vector in ascending order
>final.rolls.g.m
      [,1] [,2] [,3] [,4]
 [1,]    2    3    4    5
 [2,]    3    4    5    6
 [3,]    4    5    6    7
 [4,]    5    6    7    8
 [5,]    6    7    8    9
 [6,]    7    8    9   10
 [7,]    8    9   10   11
 [8,]    9   10   11   12
 [9,]   10   11   12   13
[10,]   11   12   13   14
[11,]   12   13   14   15
[12,]   13   14   15   16
[13,]   14   15   16   17
[14,]   15   16   17   18
[15,]   16   17   18   19
[16,]   17   18   19   20
[17,]   18   19   20   21
[18,]   19   20   21   22
[19,]   20   21   22   23
[20,]   21   22   23   24
This shows the 80 possible outcomes of using a guidance spell. Now we can look at a summary of the data.
> summary(final.rolls.g)
Min. | 1st Qu. | Median | Mean | 3rd Qu. | Max.
   2 |       8 |     13 |   13 |      18 |  24
Note: the median = the mean which suggests that the distribution is symmetrical.
Simulating Enhance Ability Rolls
Enhance Ability gives advantage on all rolls in a specific category. So how do those rolls work out?
> # first roll
> f.roll.ea = c(1:20)
> # second roll
> s.roll.ea = c(1:20)
> # which is larger
> greater.roll.ea = outer(f.roll.ea, s.roll.ea, '>=')
From this code, we get a 20x20 matrix of TRUE/FALSE values. We see that each number, x, is >= the other number x times (1 is >= once, 20 is >= twenty times). We can then create a vector of all the possible Enhance Ability outcomes. (I won't print the vector because it has a length of 210)
> final.rolls.ea = c(rep(1:20, 1:20))
> summary(final.rolls.ea)
Min. | 1st Qu. | Median |  Mean | 3rd Qu. |  Max.
1.00 |   10.00 |  14.50 | 13.67 |   18.00 | 20.00
In comparison to guidance, we see that Enhance Ability has a median > mean. This means that it's distribution is left-skewed i.e. there are more values at the upper end of the range.
Comparing
          Spell | Min. | 1st Qu. | Median |  Mean | 3rd Qu. |  Max.
       Guidance |    2 |       8 |     13 |    13 |      18 |    24
Enhance Ability | 1.00 |   10.00 |  14.50 | 13.67 |   18.00 | 20.00
So Enhance Ability has a lower min and max but a higher mean and median.
Distributions
But those numbers don't always give us the best idea of which is better. Density plots show that while the max roll you can get from guidance is higher, enhance ability is more likely to result in a higher roll more of the time.
> #turn vectors into a data frame
> Spell <- c(rep("Guidance", length(final.rolls.g)), rep("EA", length(final.rolls.ea)))
> Roll <- c(final.rolls.g, final.rolls.ea)
> compare = data.frame(Roll, Spell)
> # density plots using ggplot
> library(tidyverse)
> ggplot(compare, aes(x = Roll, fill = Spell)) + geom_density(alpha = 0.5) + scale_fill_manual(values=c("#FF33FF", "#66CCFF")) + labs(title="Distribution of Rolls by Spell") + theme(plot.title = element_text(hjust = 0.5))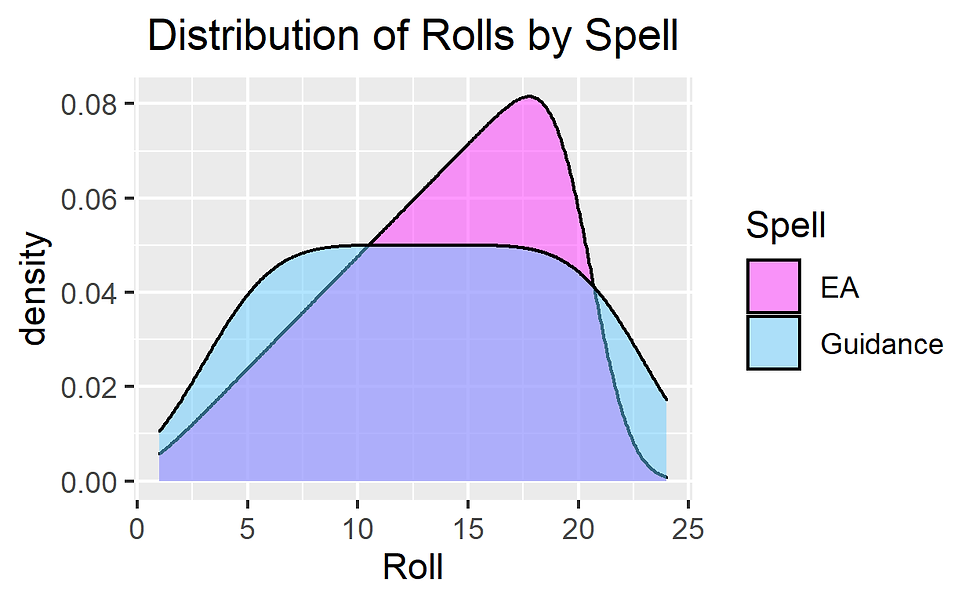
In combination
So far we've been analysing these spells individually because they're concentration and you can only have cast one at a time as a spellcaster. But say you had a fellow spellcaster in your party who cast Guidance on you while you were concentrating on Enhance Ability? Luckily for my half-orc they have 4 spellcaster friends in their party who all love a trip to the library.
> combo.rolls.m = outer(final.rolls.ea, d4.g, '+') # creates a matrix of all the possible rolls
> combo.rolls = c(combo.rolls.m) #turns those rolls into a vector
Just for scale, guidance gave us 80 outcomes, enhance ability gave 210, both gives 840 possible outcomes.
          Spell | Min. | 1st Qu. | Median |  Mean | 3rd Qu. |  Max.
       Guidance |    2 |       8 |     13 |    13 |      18 |    24
Enhance Ability | 1.00 |   10.00 |  14.50 | 13.67 |   18.00 | 20.00
           Both | 2.00 |   13.00 |  17.00 | 16.17 |   20.00 | 24.00
So "Both" has the same max and min as Guidance but a way higher mean and median than either spell alone.
And on the density plot we can see that having both spells has the same likelihood of a higher roll as enhance ability but it's shifted to the right by 4.
> Spells <- c(rep("Guidance", length(final.rolls.g)), rep("EA", length(final.rolls.ea)), rep("Both", length(combo.rolls)))
> Rolls <- c(final.rolls.g, final.rolls.ea, combo.rolls)
> compare2 <- data.frame(Rolls, Spells)
> ggplot(compare2, aes(x = Rolls, fill = Spells)) + geom_density(alpha = 0.5) + scale_fill_manual(values=c("#9933FF", "#FF33FF", "#66CCFF")) + labs(title="Distribution of Rolls by Spell") + theme(plot.title = element_text(hjust = 0.5))
So from these simulations we see that having both spells active is better than either spell alone. It should be noted that I haven't included any ability modifiers in these simulations and that would definitely affect the individual results.
How it actually played out
Simulations are lovely but in reality when my half-orc went to research I rolled low on both Enhance Ability rolls and the Guidance d4 and failed my investigation check. But what's D&D if not making elaborate plans only to roll poorly.
And as a thank you for reading, here is some amazing art of my half-orc by my friend Fio
N/B: All coding was done in R, all code was written with the assumption that the dice are fair dice, graphs were creating using the ggplot2 package.
This content was produced on Cammeraygal Country.

Comments